- Home
- ...
- Smarter Targeting of Erosion Control (STEC)
- Smarter Targeting of Erosion Control (STEC) News
Cost-effectiveness of erosion mitigation to meet water clarity targets in the Manawatū-Whanganui Region of New Zealand
Soil erosion is a significant global issue, and in New Zealand it leads to reduced land productivity, poorer water quality, and biodiversity loss (Krausse et al. 2001). The economic impact of soil erosion and landslides in New Zealand is estimated at $300 million annually (Ministry for the Environment et al. 2019). To address this, government agencies and regional councils are implementing policies and programmes, including the National Policy Statement for Freshwater Management 2020, which mandates regional councils to set and achieve targets for suspended fine sediment.
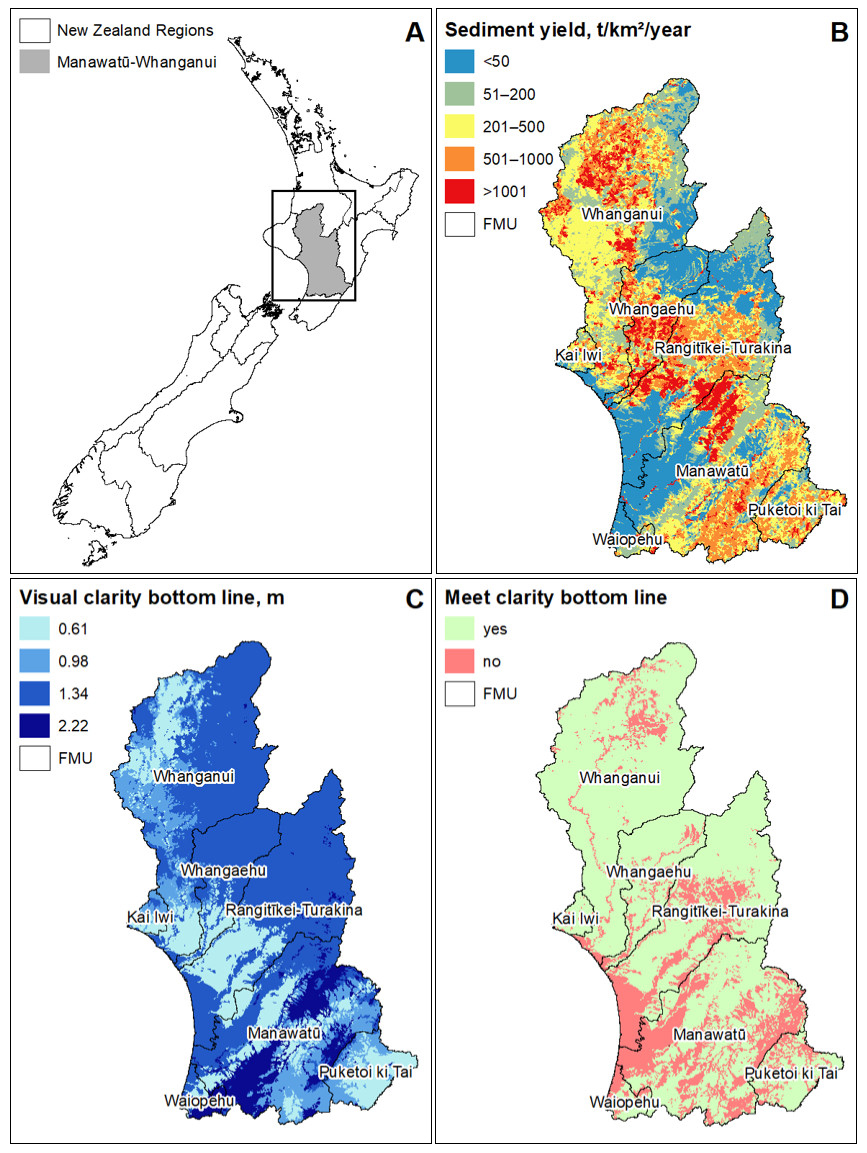
This analysis provides crucial information for planning and implementing effective erosion mitigation strategies. It leverages the SedNetNZ model, which simulates erosion and sediment transport, to evaluate the cost-effectiveness of various erosion mitigation measures in the Manawatū-Whanganui Region. SedNetNZ was used to predict suspended sediment loads under different on-farm mitigation scenarios over 5-year intervals. The measures considered included afforestation, bush retirement, riparian retirement, space-planted trees, and gully tree planting. The maps in Figure 1 show sediment yields, the visual clarity bottom lines for watersheds in the region, and those meeting these bottom lines as of 2021.

Figure 1. Sediment yields, national baseline for water clarity (NBLWC), and watersheds that met the NBLWC in the Manawatū-Whanganui Region in 2021 (Vale et al. 2023) Note: FMU = freshwater management unit.
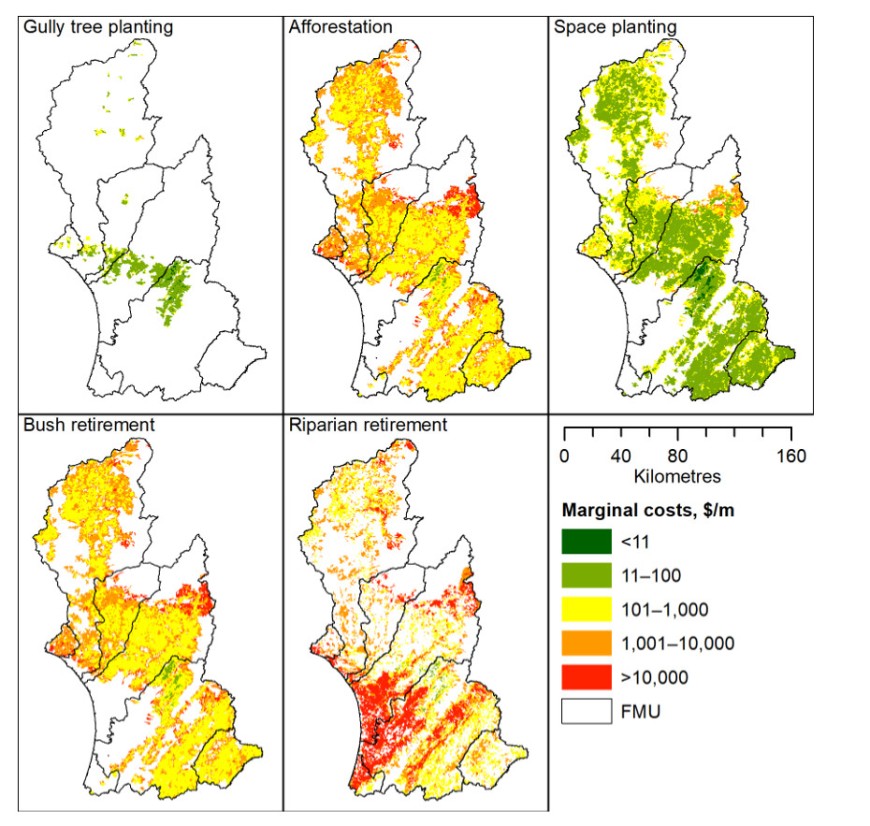
We estimated the marginal costs of achieving water clarity targets using the SedNetNZ outputs (Vale et al. 2023), region-specific mitigation costs from the Horizons Regional Council’s Hill Country Erosion Programme, and opportunity costs from the NZFARM model (Daigneault et al. 2018). These marginal costs vary significantly due to the variability of baseline sediment loads and the type of mitigation measure. Figure 2 illustrates the spatial distribution of these marginal costs.
The median marginal costs for achieving the water clarity bottom line vary significantly: $23/m for gully tree planting, $59/m for space-planted trees, $569/m for bush retirement, $660/m for afforestation, and $4,967/m for riparian retirement. These differences reflect the varying effectiveness and costs of the mitigation measures, and the sediment load and erosion characteristics of the landscapes where they are applied. For instance, gully tree planting is the most cost-effective due to the high sediment load from gullies. In contrast, riparian retirement is the least cost-effective because it is more expensive and typically applied to flatter areas with lower sediment generation.

Figure 2. The spatial distribution of the marginal cost of achieving the NBLWC ($/m) in the Manawatū-Whanganui region, by mitigation measure. The marginal costs are shown only for REC2 watersheds where gully tree planting, afforestation, space planting, bush retirement, and riparian retirement were modelled by Vale et al. (2023).
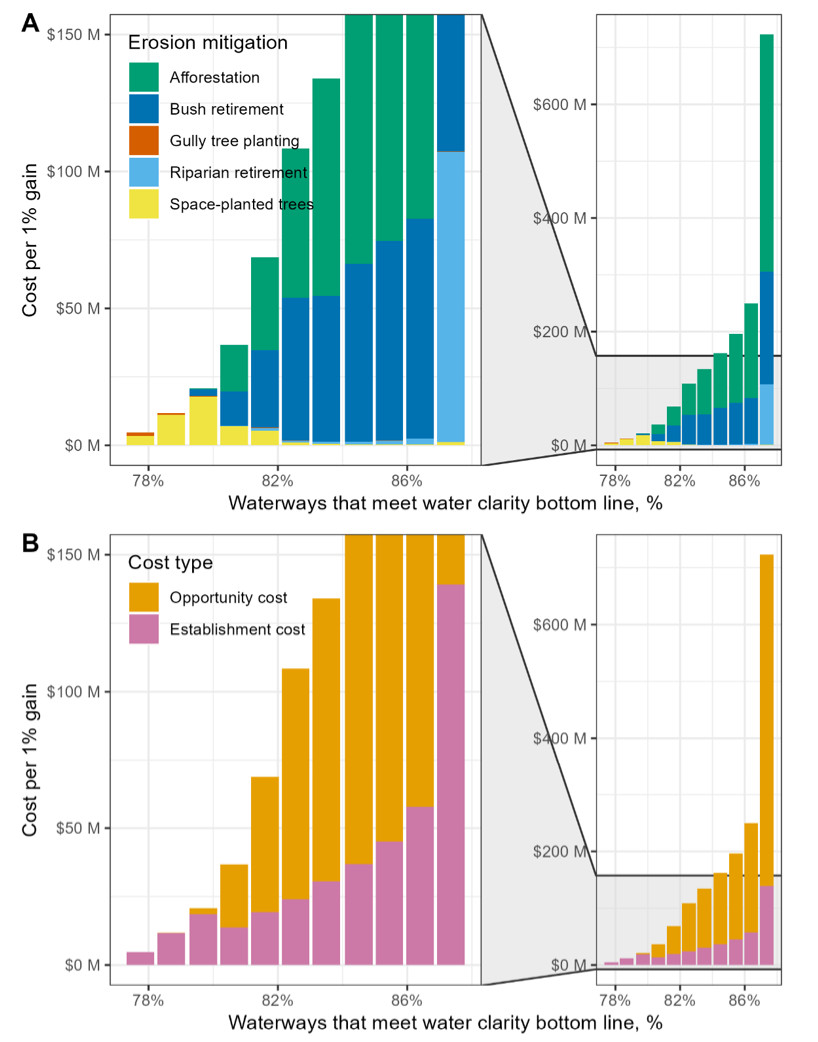
To visualise and compare the cost-effectiveness of achieving the NBLWC, we developed a marginal abatement cost curve (Figure 3). This orders mitigation measures by cost-effectiveness, grouping them into bins, where each bin represents a 1% increase in the stream network meeting the national water clarity standard. The x-axis shows the percentage of streams meeting the target, while the y-axis shows the cost of achieving each additional 1%. The cost of improving water clarity rises almost exponentially, reflecting typical trends in water quality improvement. This prioritisation ensures that the most cost-effective measures are implemented first, maximising the improvement in water clarity for the resources invested.

Figure 3. The marginal abatement costs curve of achieving the NBLWC, broken down by mitigation measures (afforestation, bush retirement, gully tree planting, riparian retirement, and space-planted trees) (A), and by type of costs (establishment and opportunity) (B ).
New Zealand faces a significant erosion problem, and efforts are underway to combat it with new methods and policies. Given constrained budgets, it is crucial to consider the costs and benefits of erosion mitigation. In this study we demonstrate a method for estimating the cost-effectiveness of erosion mitigation measures for achieving water clarity targets. Our findings show that the cost depends on factors such as sediment load, mitigation costs, and land-use profitability.
These results are specific to the study region but can be applied to other areas. If widely used they can help identify trade-offs in a cost–benefit decision framework. The estimates depend on existing research on productivity impacts and the quality of erosion and land-use data. These findings can also be combined with other cost–benefit estimates developed in the STEC programme, such as the non-market values of water quality benefits and the effect of soil erosion on agricultural productivity.
References
Daigneault A, Greenhalgh S, Samarasinghe O 2018. Economic impacts of multiple agro-environmental policies on New Zealand land use. Environmental and Resource Economics 69: 763-785.
Krausse MK, Eastwood CR, Alexander RR 2001. Muddied waters: Estimating the national economic cost of soil erosion and sedimentation in New Zealand, Landcare Research.
Ministry for the Environment, Stats NZ 2019. New Zealand’s Environmental Reporting Series. Environment Aotearoa.
Neverman A, Djanibekov U, Soliman T, Walsh P, Spiekermann R, Basher L 2019. Impact testing of a proposed sediment attribute: identifying erosion and sediment control mitigations to meet proposed sediment attribute bottom lines and the costs and benefits of those mitigations. Manaaki Whenua – Landcare Research.
Polyakov M, Walsh P, Daigneault A, Vale S, Phillips C, Smith H 2024. Cost-effectiveness of erosion mitigation to meet water clarity targets in the Manawatū-Whanganui Region of New Zealand. Journal of Environmental Management 359: 120991.
Soliman T, Walsh P 2021. Valuing the effect of soil erosion on productivity: A spatial explicit analysis from New Zealand. Unpublished manuscript.
Vale S, Smith H 2023. Application of SedNetNZ using updated erosion mitigation s with climate change scenarios in the Horizons region to support NPS FM 2020 implementation. Manaaki Whenua – Landcare Research. Contract Report: LC4295. Prepared for Horizons Regional Council.
Walsh PJ, Soliman T, Wiercinski B 2021. The benefits and costs of erosion control in New Zealand: estimates for policy analysis. Manaaki Whenua – Landcare Research. Contract Report: LC3924 prepared for MBIE Endeavour Programme “Smarter Targeting of Erosion Control”.
