- Home
- ...
- Smarter Targeting of Erosion Control (STEC)
- Smarter Targeting of Erosion Control (STEC) News
Visual clarity regime of the Manawatū River
The National Policy Statement for Freshwater Management (NPS-FM, Ministry for the Environment 2020) gives standards, referred to as ‘target attribute states’, for visual clarity (at Table 8) to protect New Zealand river ecosystems from the adverse effects of suspended fine sediment. (Standards are also given at Table 16 for the attribute of deposited fine sediment.)
The river sediment component of STEC entailed sampling storm flows in the Manawatū catchment by auto-sampler to measure suspended sediment concentrations and characterise suspended particulate matter in terms of particle size distribution, light beam attenuation, and organic content (Davies-Colley et al. 2024). Light beam attenuation was measured in the NIWA (Hamilton) water quality laboratory using a beam transmissometer operated in flow-through mode on diluted stormflow samples (Davies‐Colley et al. 2021). Black disc visibility over stormflows was estimated with good accuracy from the measured light beam attenuation coefficient using semi-empirical equations given by Zanevald and Pegau (2003).
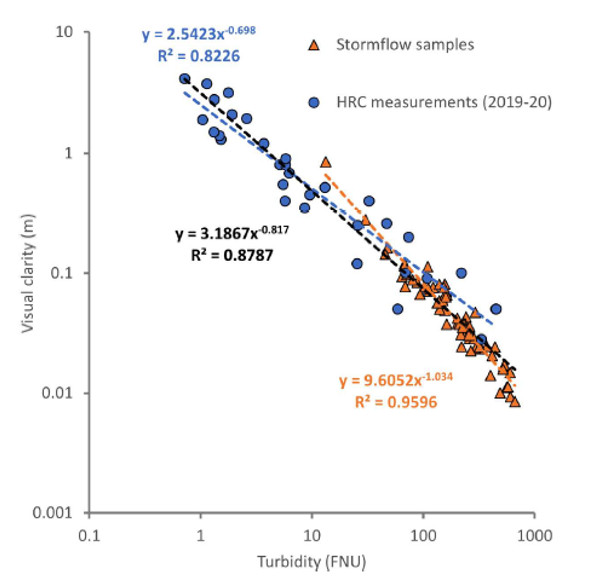
Figure 1 shows the visual clarity estimates from measurements on (muddy!) stormflow auto-samples during our 2019/20 campaign at Horizons’ key site on the Manawatū River at the Teachers College . Also shown in Figure 1 are direct observations of visual clarity by Horizons staff using the black disc method during monthly routine sampling visits in 2019/20. Both the directly observed and estimated black disc visibility are plotted against high-frequency turbidity recorded by an EXO2 sonde operated by Horizons in the river water. It is interesting to note that river visual clarity ranges very widely (nearly 1,000-fold) – from as high as 5 m in clear baseflow conditions to about a centimetre during high stormflows.
Figure 1 amounts to a local ‘rating’ of high-frequency turbidity to visual . The rating is only ‘local’ in the sense that it only applies to this particular combination of turbidity sensor and river site. The rating of turbidity to black disc visibility in Figure 1 is analogous to the more familiar rating of river discharge to water level. By applying the power equation corresponding to the overall regression line (black) in Figure 1 to the full high-frequency turbidity record at 15 min intervals, we can obtain a picture of the visual clarity regime of the river over all states of flow.

Figure 1. Black disc visibility versus turbidity in the Manawatū River at the Teachers College site. Turbidity was recorded at 15 min intervals by an EXO2 sonde operated by Horizons. Blue dots are field observations of black disc visibility by Horizons field staff (HRC) in 2019/20. Orange triangles are estimates of visual clarity from NIWA’s light beam attenuation measurements on stormflow auto-samples during the same time period. The power law equation for the black regression line was used as an overall rating of turbidity to visual clarity . FNU is formazin nephelometric units.
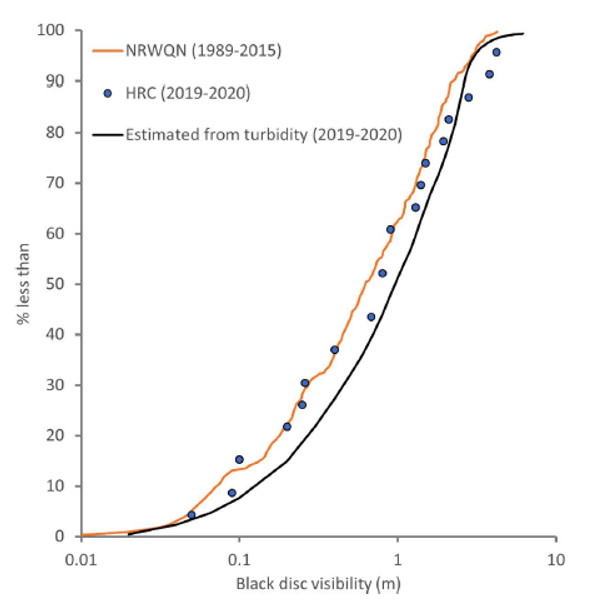
Figure 2 shows the cumulative frequency distribution of visual clarity estimated from the (local) calibration of the EXO turbidity record for 2019/20 during our field campaign of stormflow sediment sampling (smooth black curve). The direct observations of visual clarity by Horizons in 2019/20 are shown as blue dots. Also shown in Figure 2 is the distribution of long-term (1989–2015) monthly visual clarity observations (n = 328; orange jagged curve) by NIWA at this site, before the water quality sampling was taken over by Horizons. Evidently the Manawatū is not a particularly clear river by New Zealand standards (the median of 0.62 m is about the 20th percentile of 77 New Zealand river sites in the National Rivers Water Quality Network) (Smith et al. 1997).

igure 2 . Cumulative frequency distributions for black disc visibility in the Manawatū River at the Teachers College site. The smooth black curve (median = 0.93 m) is the distribution of visual clarity estimated from the high-frequency turbidity record for 2019/20 using the turbidity ‘rating’ to black disc visibility in Figure 1. The blue dots are the field observations of black disc visibility by Horizons staff (HRC) in 2019/20. The jagged orange curve (median = 0.62 m) is the distribution of black disc visibility observations (n = 328) at this site by NIWA in the National Rivers Water Quality Network (NRWQN, site WA8) over the long term (1989–2015).
The overall shape of the visibility distribution, as predicted from the rated turbidity record for 2019/20, is very similar to that observed over the long term – with the exception of the high clarity / low turbidity tail. The discrepancy in shape here might reflect the vulnerability of very low turbidity to bias from biofouling. More importantly, the median visual clarity was 50% higher in 2019/20 than over the long term (0.93 m versus 0.62 m).
The New Zealand guideline for swimming suitability (Ministry for the Environment 1994) is black disc visibility greater than 1.6 m; this was only achieved in the Manawatū River about 15% of the time during 1989–2015, but about 30% of the time during our 2019/20 sampling campaign. At first we thought a real improvement in visual clarity might have occurred in recent years. This seemed plausible, because Snelder (2018) reported a weak trend of improved water quality (increased visual clarity and decreased faecal contamination, as indicated by E. coli) in those Manawatū sub-catchments where land management action (farm plans for soil conservation) had been implemented in Horizons’ Sustainable Land Use initiative (www.horizons.govt.nz/managing-natural-resources/land ). So could we be seeing an improvement in water quality at the main-stem river (full basin) scale?
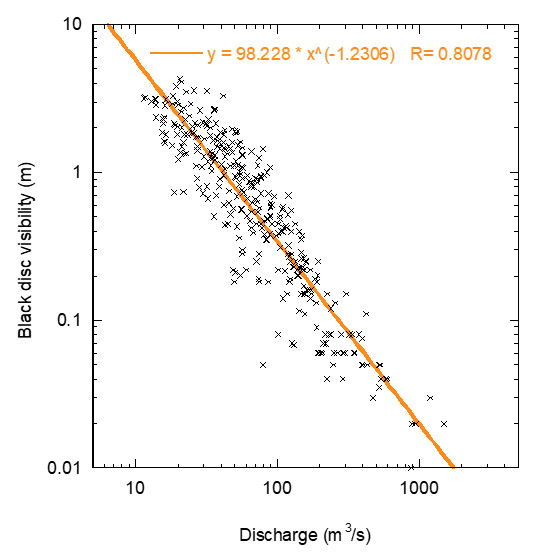
Unfortunately this turned out to be too good to be true. Our 2019/20 campaign was a dry period, with few large flood events approaching the annual flood. Indeed, owing to the disruption of Covid-19 combined with a comparative lack of floods, we struggled to intercept sufficient large events for the purposes of our study. Because visual clarity in the Manawatū River is strongly inversely correlated with flow (Figure 3), it seemed feasible that a clearer river in 2019/20 might simply reflect comparatively low flows. The power regression equation in Figure 3 suggests that the 30% lower-than-average flow in 2019/20 figure does quantitively account for the 50% higher-than-average visual clarity in this period (Davies-Colley et al. 2024), so there is no reason to think the visual clarity regime of the Manawatū River has actually shifted.
The use of high-frequency turbidity as a proxy for visual clarity (with local calibration) in this study has proved instructive. Turbidity has long been used as a proxy for suspended sediment concentration in river sediment load studies, but the application of high-frequency turbidity to define the visual clarity regime of rivers should provide a powerful new approach for implementing the visual clarity standards in the NPS-FM (Haddadchi et al. 2022).

Figure 3. Visual clarity versus discharge in the Manawatū River at the Teachers College site, from monthly observations by NIWA (1989–2015). The inverse relationship is fairly well fitted by a power expression.
References
Davies-Colley RJ, Hughes AO, Haddadchi A, Dymond JR, Vale SS, Smith HG 2024. Suspended sediment properties and visual clarity of the Manawatū River, New Zealand. New Zealand Journal of Marine and Freshwater Research 1-22.
Davies‐Colley R, Hughes AO, Vincent AG, Heubeck S 2021. Weak numerical comparability of ISO‐7027‐compliant nephelometers: ramifications for turbidity measurement applications. Hydrological Processes 35: e14399.
Haddadchi A, Hicks M, Milne J, Semedeni-Davies A, Mathews Y, Swales A, Rautenbach C 2022. Guidance for implementing the NPS-FM sediment requirements. Wellington, Ministry for the Environment.
Ministry for the Environment 1994. Water quality guidelines No. 2: guidelines for the management of water colour and clarity. Wellington, Ministry for the Environment.
Ministry for the Environment 2020. National policy statement for freshwater management. Wellington, Ministry for the Environment.
Smith DG, Davies-Colley RJ, Knoeff J, Slot GWJ 1997. Optical characteristics of New Zealand rivers in relation to flow. Journal of the American Water Resources Association 33: 301–312.
Snelder T 2018. Assessment of recent reductions in E. coli and sediment in rivers of the Manawatū-Whanganui Region, including associations between water quality trends and management interventions. LWP Client Report, Christchurch, LandWaterPeople.
Zanevald JRV, Pegau WS 2003. Robust underwater visibility parameter. Optics Express 11: 2997–3009.