Benchmark results from New Zealand’s soil carbon monitoring programme for agricultural land
Here, in work funded by the New Zealand Agricultural Greenhouse Gas Research Centre, the Ministry for Primary Industries, and Manaaki Whenua – Landcare Research, we outline benchmark results from New Zealand’s national soil carbon monitoring programme, in which 504 sites were established to determine a robust baseline of SOC stocks for agricultural land on mineral (non-organic) soils in New Zealand. Sampling sites were representatively spread across five broad land-use classes: dairy pasture, flat-rolling drystock pasture, hill-country drystock pasture, cropland, and perennial horticulture.
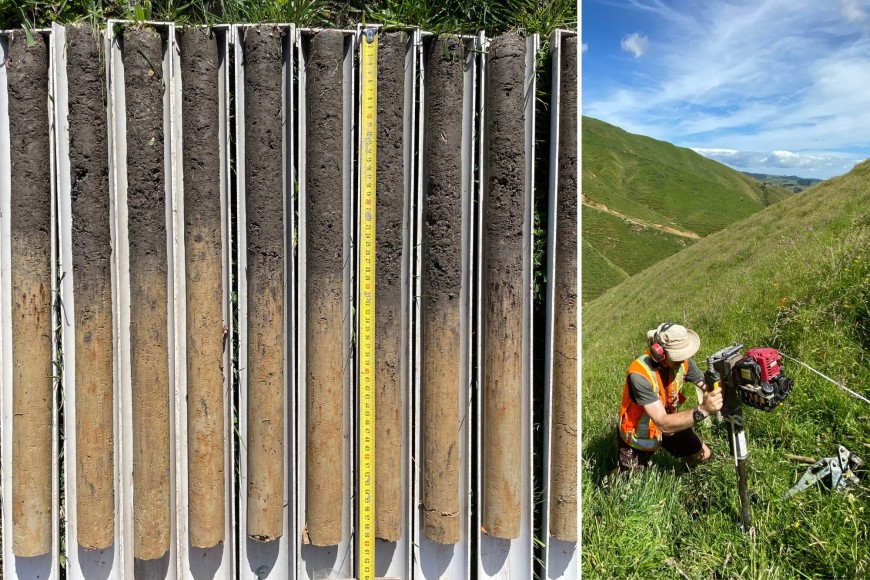
At each of the 504 sites soil samples were collected from a 20 × 20 m plot in 10 cm increments to a maximum depth of 60 cm. Continuous soil cores was the preferred sampling method (see figure). When soil cores could not be collected due to stones, the quantitative pit method was used, and for very steep or remote sites, or for loose and unconsolidated soils, bulk density rings were collected. The samples were tested for SOC and total nitrogen at Manaaki Whenua – Landcare Research’s Environmental Chemistry Laboratory in Palmerston North.

Continuous soil core sampling. Left: 10 soil cores collected from a site. Right: soil core sampling using a mechanical waratah driver.
Our results showed an average across all New Zealand’s agricultural land on mineral soils of 101 tonnes of SOC per hectare in the 0–30 cm layer, and 138 tonnes per hectare in the 0–60 cm layer. These values are higher than in many other countries, which is largely due to a landscape dominated by perennial vegetation and a temperate climate that allows year-round plant growth, and thus carbon inputs to the soil. SOC stocks in the 0–30 cm layer were highest under dairy pasture, followed by hill-country drystock pasture, flat-rolling drystock pasture, and perennial horticulture, and were lowest under cropland.
Differences across land uses could not be attributed to land use alone, because the location of different land uses depends on soil type and climate. For example, there are proportionally more dairy pasture sites on Allophanic soils than in the other land-use classes, which have naturally high SOC stocks. When data from Allophanic soils were excluded, SOC stocks under dairy pastures were more similar to those of the other grassland classes. A full manuscript detailing the methodology and results has been submitted to a peer-reviewed journal.
For the first time these results provide spatially representative data to feed into national soil carbon inventory reporting, and they are a crucial baseline against which to compare future sampling. To determine if SOC stocks are changing over time within the different land-use classes, sites will be re-sampled every 4 to 5 years on a rolling schedule, which commenced in 2023. Knowing if and how SOC stocks are changing under our agricultural land will enable more informed decisions on how changes in land use and management could be used to maintain or increase SOC stocks.
Acknowledgements
We are indebted to all the farmers who allowed access for sampling and provided information on land use and management. The project would not have been possible without them. Funding was from the New Zealand Agricultural Greenhouse Gas Research Centre, the Ministry for Primary Industries and Manaaki Whenua – Landcare Research.
Further reading
Mudge P 2022. An update on the national soil carbon benchmarking and monitoring system for agricultural land in New Zealand


